Geography
The #1 US Land Port You've Never Heard Of
Laredo, Texas — population 256,000 — has the second-highest absolute concentration of active freight forwarders in the US and nine times the density of Los Angeles. The infrastructure built around the Mexico land border is freight geography most analysts miss.
A city that exists for one reason
Drive into Laredo, Texas from the north on Interstate 35. There’s nothing for miles — south Texas brush, a few exits with truck stops, the occasional billboard. Then, somewhere around mile marker 13, the warehouses start. Trailers parked twelve deep at logistics yards. Truck-only fuel stops every couple of miles. By the time you reach the city itself, the freight infrastructure has been visible for thirty minutes.
At the border, on any given weekday, four to six lanes of semi-trucks are queued waiting for customs clearance. Almost nothing about Laredo’s economy isn’t trucking-related. It’s a city of 256,000 people that exists, more or less, to move freight across the Rio Grande.
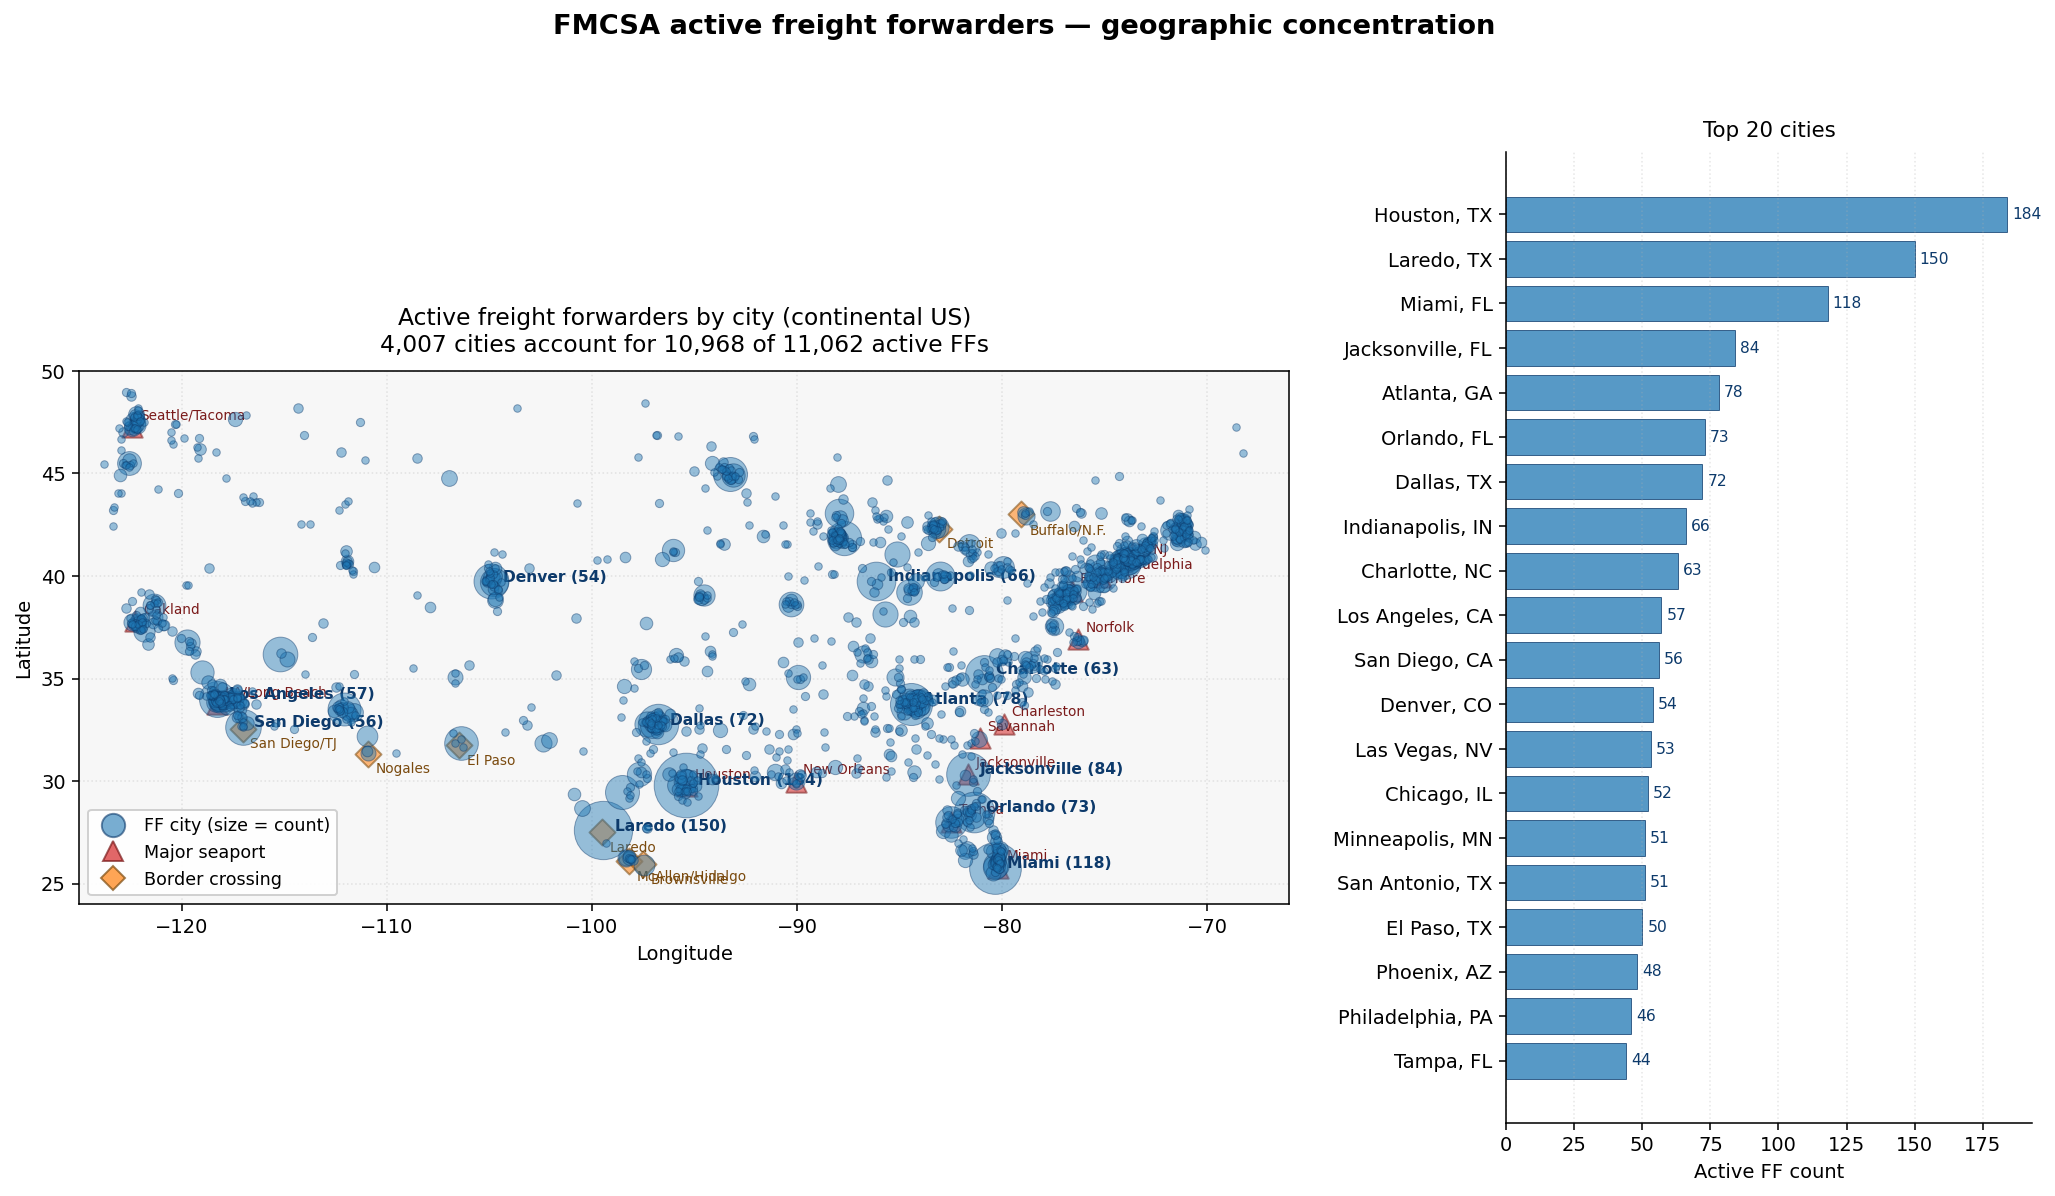
The FMCSA data confirms what the eye sees on the highway. Laredo has the second-highest concentration of active freight forwarders in the United States, ranked by absolute count — 150 of them, behind only Houston (a city nine times its size). And by density of logistics activity, Laredo is in a class of its own.
The numbers
Pull every active freight-forwarder DOT in the FMCSA database and rank cities by count:
| City | Active FFs |
|---|---|
| Houston, TX | 184 |
| Laredo, TX | 150 |
| Miami, FL | 118 |
| Jacksonville, FL | 84 |
| Atlanta, GA | 78 |
| Orlando, FL | 73 |
| Dallas, TX | 72 |
| Indianapolis, IN | 66 |
| Charlotte, NC | 63 |
| Los Angeles, CA | 57 |
| El Paso, TX | 50 |
The Houston / Laredo gap (184 vs. 150) is a 19% difference — between a top-10 US city and a town smaller than Lubbock. Now look at the same data normalized to the city’s overall logistics activity (active carriers + brokers + FFs combined):
| City | FFs | All logistics entities | % that are FFs |
|---|---|---|---|
| Laredo, TX | 150 | 5,297 | 2.83% |
| Eagle Pass, TX | 11 | 676 | 1.63% |
| El Paso, TX | 50 | 3,885 | 1.29% |
| Atlanta, GA | 78 | 6,753 | 1.16% |
| Houston, TX | 184 | 22,703 | 0.81% |
| Miami, FL | 118 | 16,821 | 0.70% |
| Chicago, IL | 52 | 6,286 | 0.83% |
| Los Angeles, CA | 57 | 18,241 | 0.31% |
Laredo has nine times the freight-forwarder density of Los Angeles. Eagle Pass — population 28,000 — has five times the density. The whole Texas border (Laredo, El Paso, Eagle Pass, McAllen, Brownsville) over-indexes on freight specialization more than any other region of the country.
And the brokers tell the same story. Laredo has 1,295 active freight brokers. That’s roughly one active FMCSA broker per 200 residents — a rate that would put about 40,000 brokers in a city like Chicago. (Chicago has 920.)
Why this happens
Laredo is the #1 US port — sea, air, or land — by trade value. Has been for years. The Mexico-US trade relationship is the largest in the world, and every truck carrying that freight has to slow down and clear customs at one of a handful of bridge crossings. Laredo handles the biggest of them: the World Trade Bridge, which processes roughly half a billion dollars of cross-border freight every business day.
That infrastructure pulls a specific industry to it:
- Customs brokers to file the paperwork.
- Bonded warehouses to hold cargo while it clears.
- Drayage carriers to move loads across the bridge in short hops.
- Freight forwarders to consolidate shipments before and after the border.
None of those services are useful anywhere else. They cluster at the chokepoint because the chokepoint is where the value is.
The same pattern repeats — at smaller scale — at every other border crossing. El Paso has 50 FFs in a city of 678K. Eagle Pass packs 676 logistics businesses into a town smaller than a Manhattan zip code. San Diego, McAllen, Brownsville, Nogales — every one of them shows the same density pattern. It’s the freight-monoculture signature.
The three-tier hub structure of US freight geography
When you map the FMCSA freight-forwarder data nationally, three categories of city dominate:
- Seaports — Houston, Miami, Jacksonville, LA, Philadelphia, Tampa. The classic “where freight comes off the boat” cities. High FF count, moderate FF density (their economies have other things going on).
- Mexican border crossings — Laredo, El Paso, San Diego, McAllen, Brownsville. Highest FF density by far. The local economy is freight, period.
- Inland intermodal hubs — Atlanta, Dallas, Indianapolis, Charlotte, Chicago, Denver, Minneapolis, Phoenix. Where rail meets trucking meets warehousing. Moderate counts, moderate density, mostly invisible to the public.
Most freight industry coverage focuses on category 1 (because it photographs well) and category 3 (because Walmart and Amazon are there). Category 2 — the border lanes — gets almost no coverage. The Texas border alone has six cities in the top-20 freight-forwarder density list. The trade press has approximately zero stories about any of them.
Why this matters
Two things to take from this:
1. US freight geography is not where most people think it is. The textbook story has freight flowing from coastal ports inland. The reality is that an enormous share of US freight value crosses a Mexican land border every day — and the industry built around handling it lives in towns most Americans can’t find on a map.
2. Trade-policy decisions about Mexico hit Texas hard and disproportionately. Any disruption to USMCA, customs clearance times, or border-crossing infrastructure isn’t just a “Texas economic issue” — it’s an immediate hit to the freight-monoculture cities that exist almost entirely to service that lane. There is no diversification. The whole local economy is one trade relationship.
If anyone wanted to understand how American freight actually works in 2026, they should spend a day at the World Trade Bridge in Laredo. The infrastructure tells the story more honestly than any white paper.
Receipts: City-level FF and broker counts from FMCSA.dbo.CompanyCensus filtered to IsFreightForwarder=1 / IsBroker=1 / IsCarrier=1 AND IsActive=1 AND PHY_COUNTRY='US', grouped by PHY_CITY/PHY_STATE. Background context on Laredo’s land-port ranking is publicly reported by US Customs and Border Protection trade statistics — independently verifiable.